ECS Dashboard: Sensors, Occupancy, and Maintenance in the Browser
The dashboard is the user interface for the EnOcean VL-700 BASE gateway: all sensors, all measured values, the floor plan with occupancy, the maintenance list, and the alarms—all in your browser, with no installation required and no per-sensor license fee. What you’ll see there and how it helps you in daily operations, page by page.
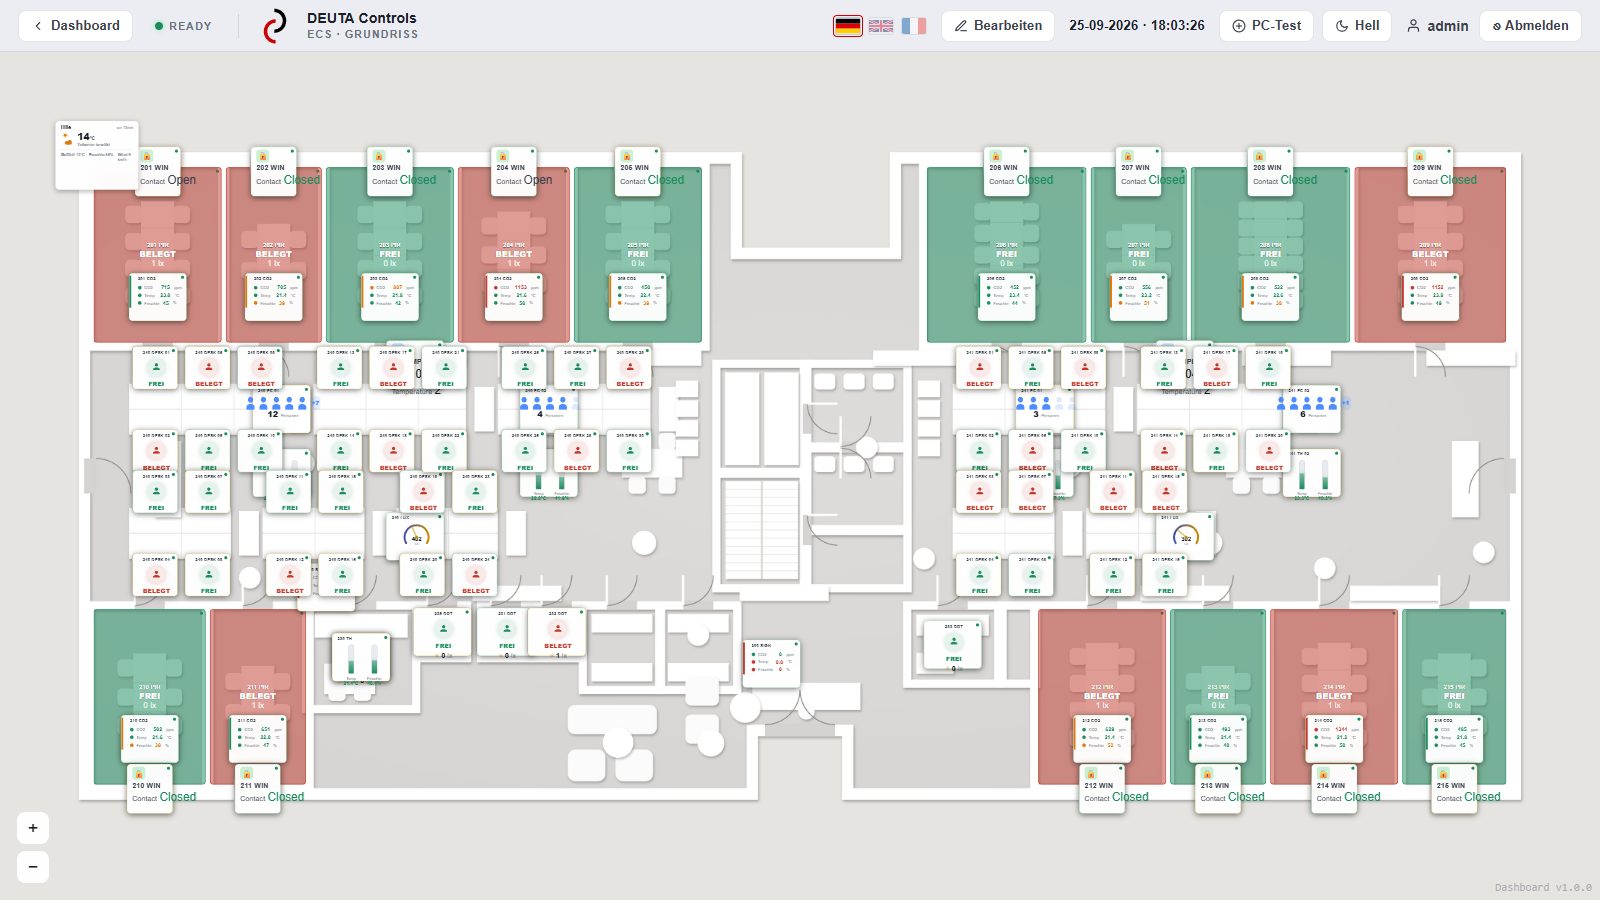
Room Occupancy and Indoor Air Quality in the Floor Plan
Floor PlanThe floor plan shows each room as an area: green for vacant, red for occupied, based on data from the room’s occupancy sensor. On the table is the CO2 tile displaying CO2 levels, temperature, and humidity; on the exterior wall is the window contact. In the open-plan office, each table sensor appears as its own tile, along with the occupancy counters at the doorways.
Tiles are placed with the mouse in edit mode; the background is your own floor plan as an image. Each tile has multiple display options, from an icon to a room area, and can be scaled using the text tool. What you see here is our sample floor—the same one you can explore interactively on the website.
In practice, this means that anyone looking at the floor plan in the morning can see at a glance which rooms are in use, where air quality is poor, and which windows are open.
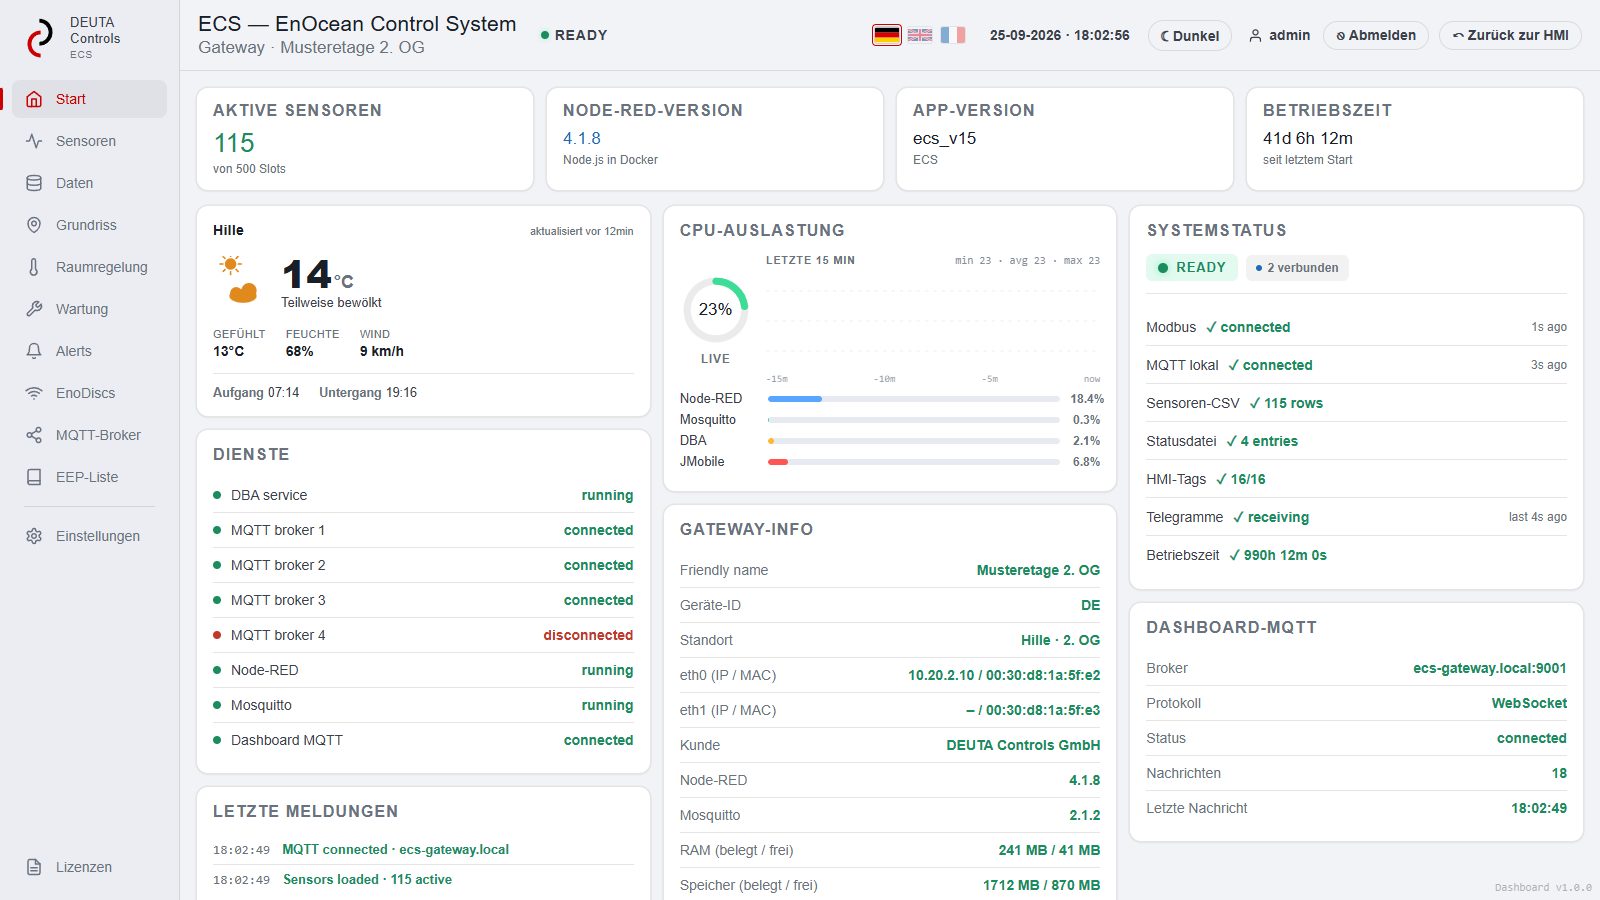
Gateway Status at a Glance
Home PageThe home page indicates whether the system is ready: number of active sensors, connection to wireless reception (Modbus), local MQTT broker, last telegram, and uptime. Below that are the gateway’s services with their status and the processor and memory utilization.
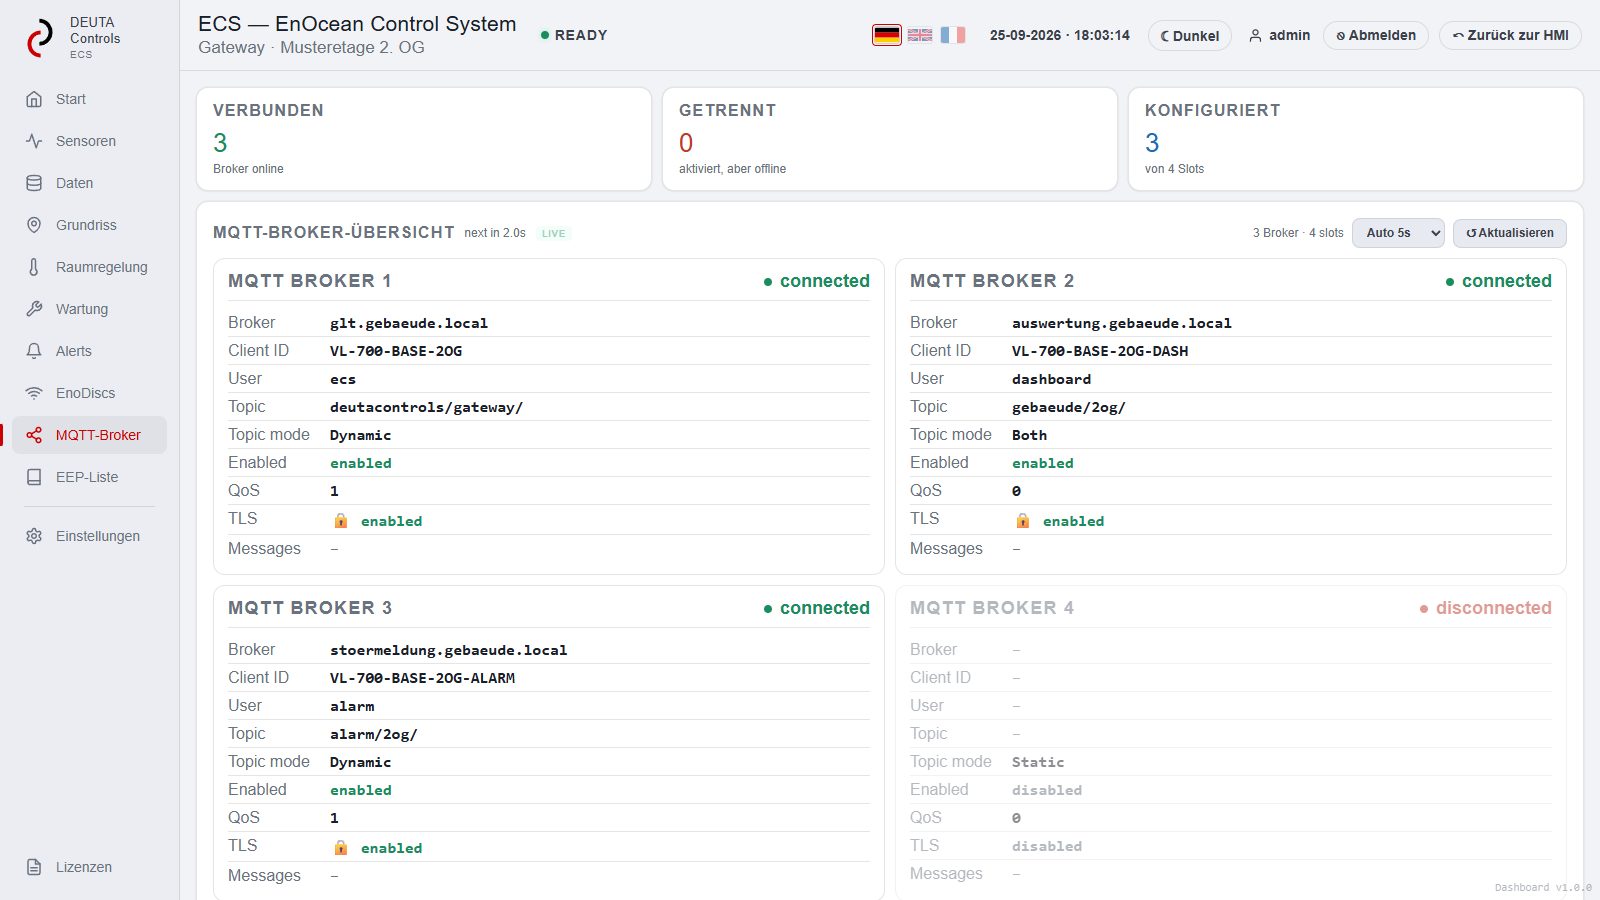
Up to four MQTT brokers can be connected in parallel—for example, process control, data analysis, and a separate broker dedicated solely to fault messages. Each has its own status bar here. The local weather and the gateway’s TLS certificates are also displayed on the home screen, so you won’t be caught off guard by an expiring certificate.
Every measurement value, decoded and with a history
Live Data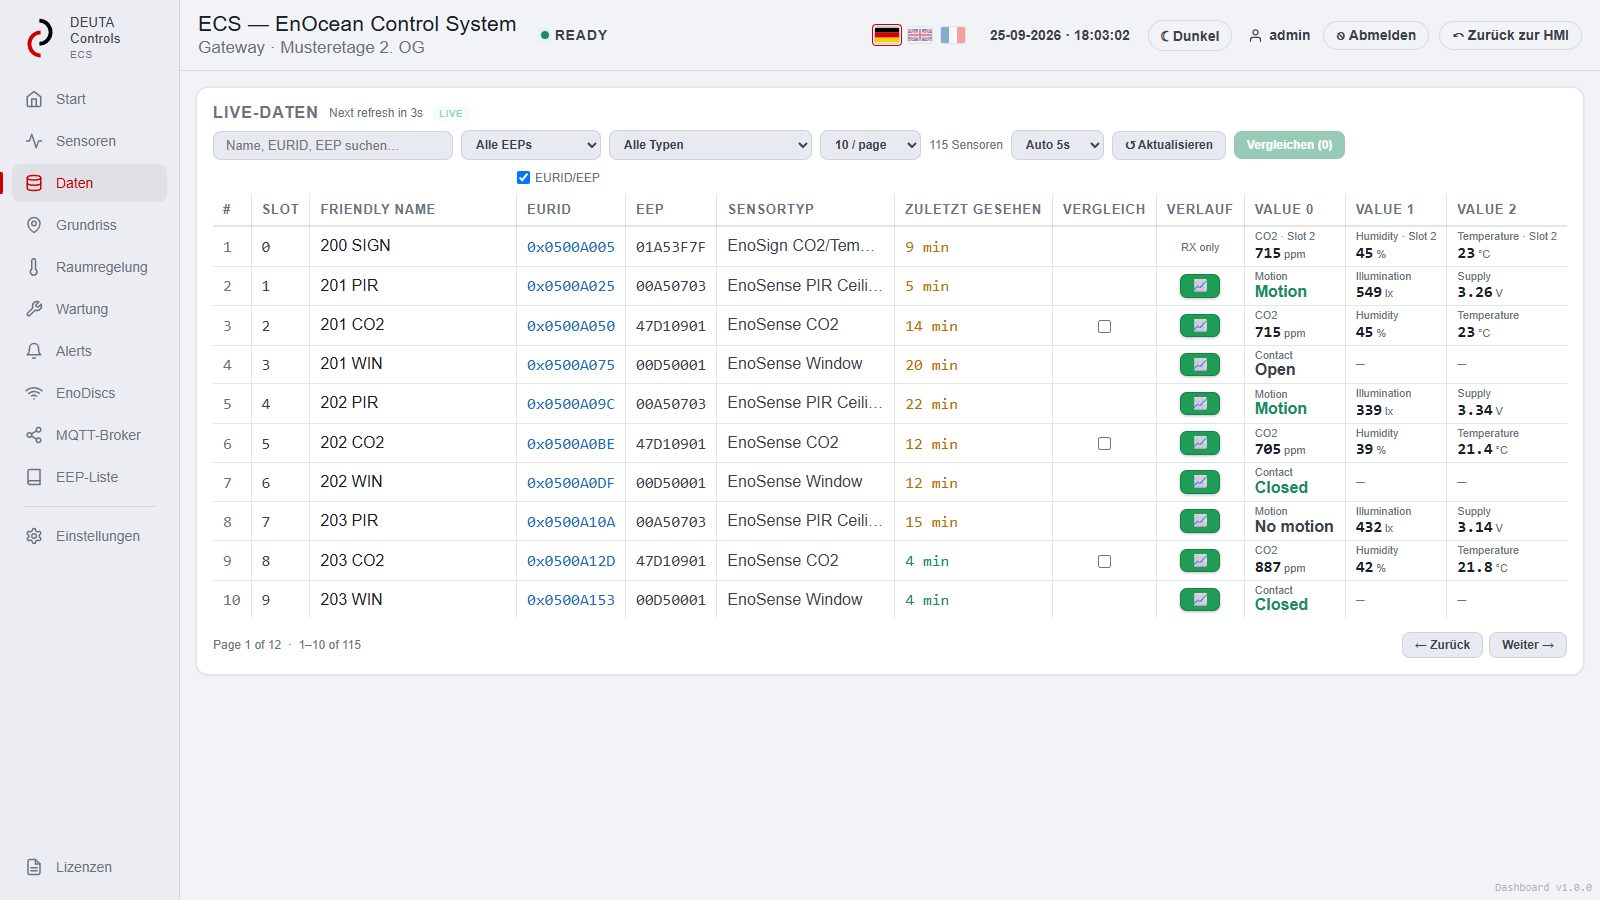
The Data page lists all sensors with their current values: CO2 in ppm, temperature, humidity, motion, brightness, window status, and number of people. The dashboard decodes the EnOcean telegrams itself based on the device profile (EEP); you see plain text, not raw data.
Clicking on a CO2 sensor opens the history with gauges and a graph for the selected time period. Two sensors can be overlaid for comparison. Filter by profile, type, and name; search by name or EnOcean ID; selectable update interval.
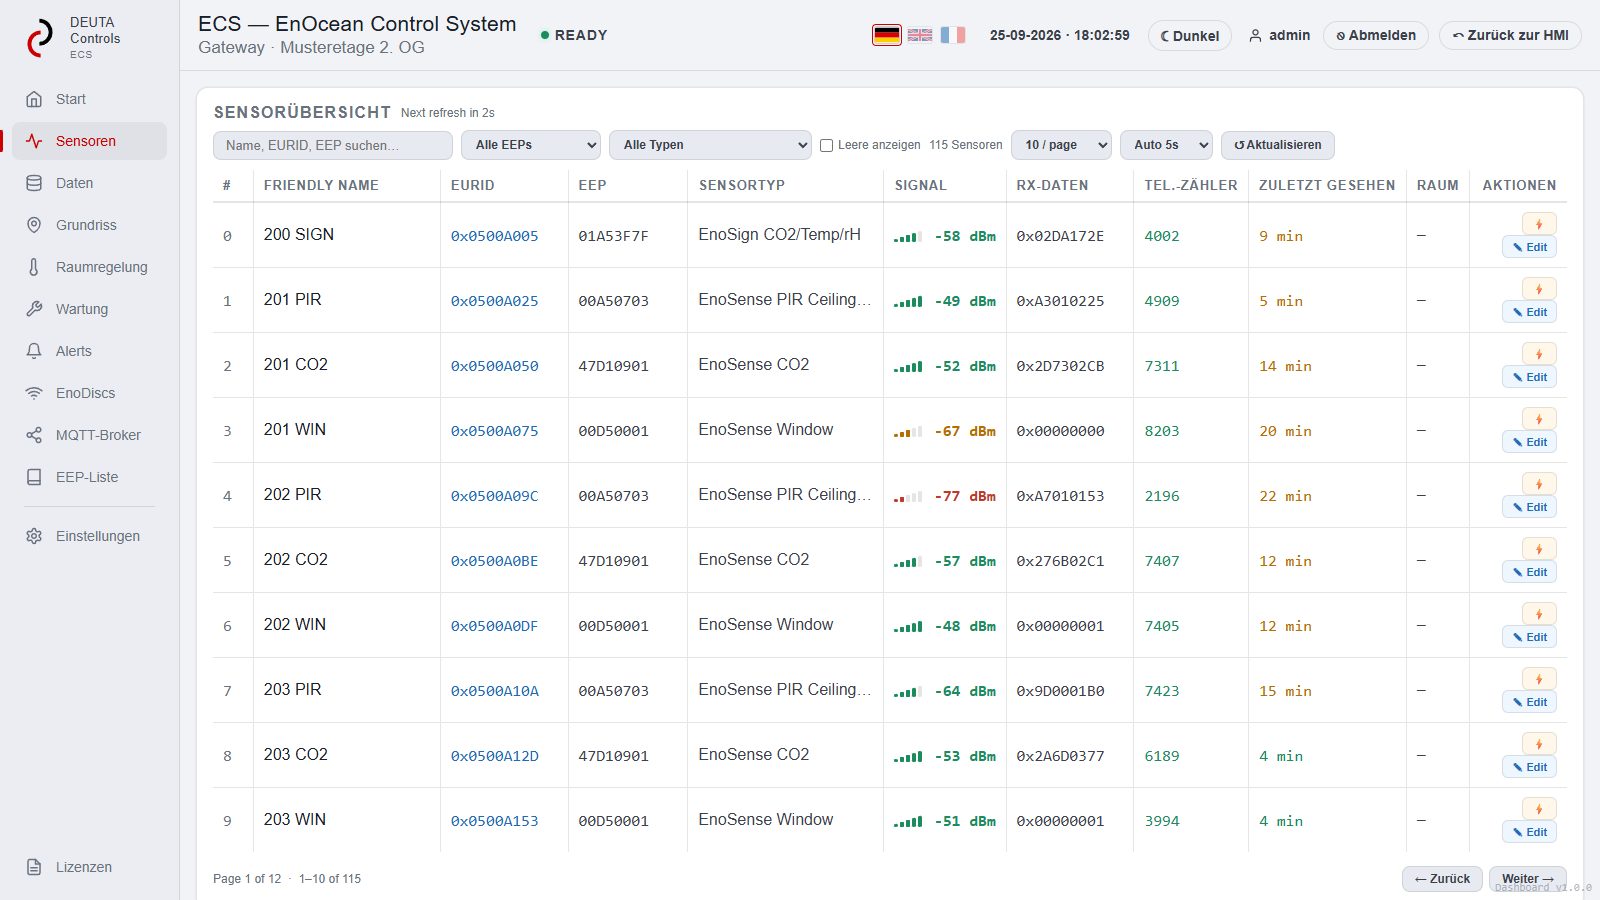
The device list with wireless signal strength
SensorsThe sensor overview is the system’s inventory list: slot, name, EnOcean ID, device profile, signal strength in dBm, telegram counter, and the time of the last reception. This allows you to see during commissioning whether a device is reaching its receiver—and during operation, whether it is still transmitting.
The list corresponds to the system’s configuration file, which you receive as part of the documentation. Anyone involved in the construction project who wants to know which sensor is installed in which room can find that information here.
How to Spot a Faulty Sensor
Alerts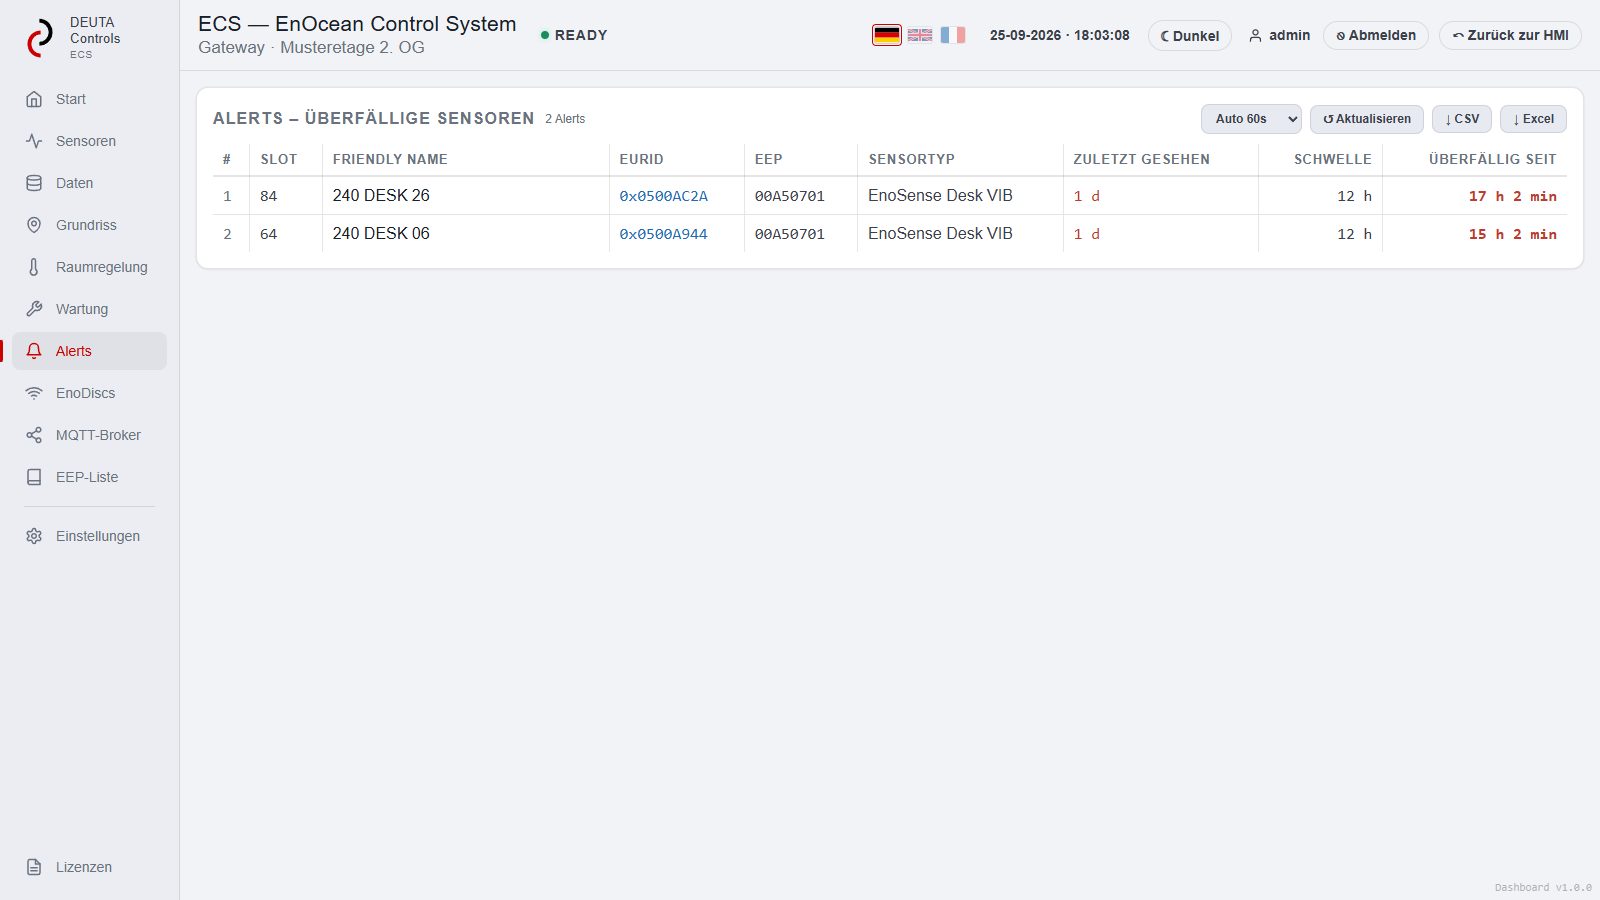
A wireless sensor does not report a malfunction; it simply stops transmitting. That is why the alerts page lists every sensor that has not reported within its expected interval—including the last reception time, the threshold, and the duration it has been overdue. Typically, the list is empty.
The threshold can be adjusted for each device profile, and the list can be exported as a CSV or Excel file. If the alert is to be sent to the control system, this is configured in the project—for example, via a second MQTT broker dedicated solely to fault alerts.
Replace batteries based on their condition, not on a schedule
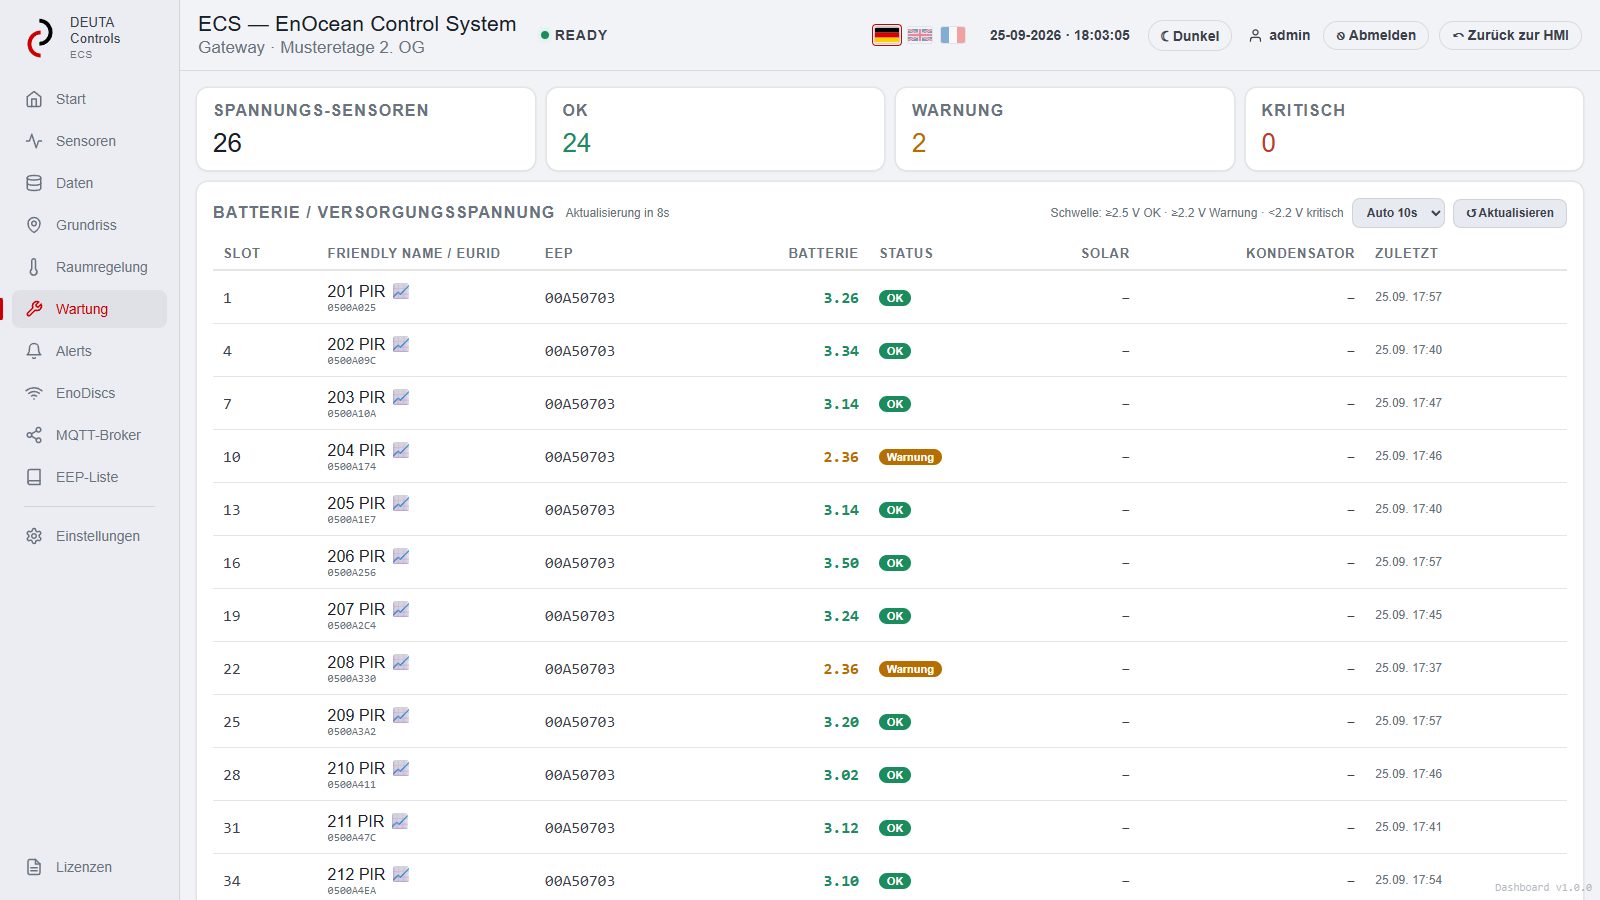
MaintenanceThe maintenance page displays the current supply voltage and a status—OK, Warning, or Critical—for each battery- or solar-powered sensor, with adjustable thresholds. Replace a device when it enters the Warning status—not because a replacement interval has expired.
Below that, you’ll see which CO2 sensors need to be calibrated. Calibration is initiated on the device using the service button; the dashboard will notify you if it’s been too long since the last calibration.
The Receivers and Their Connections
EnoDiscs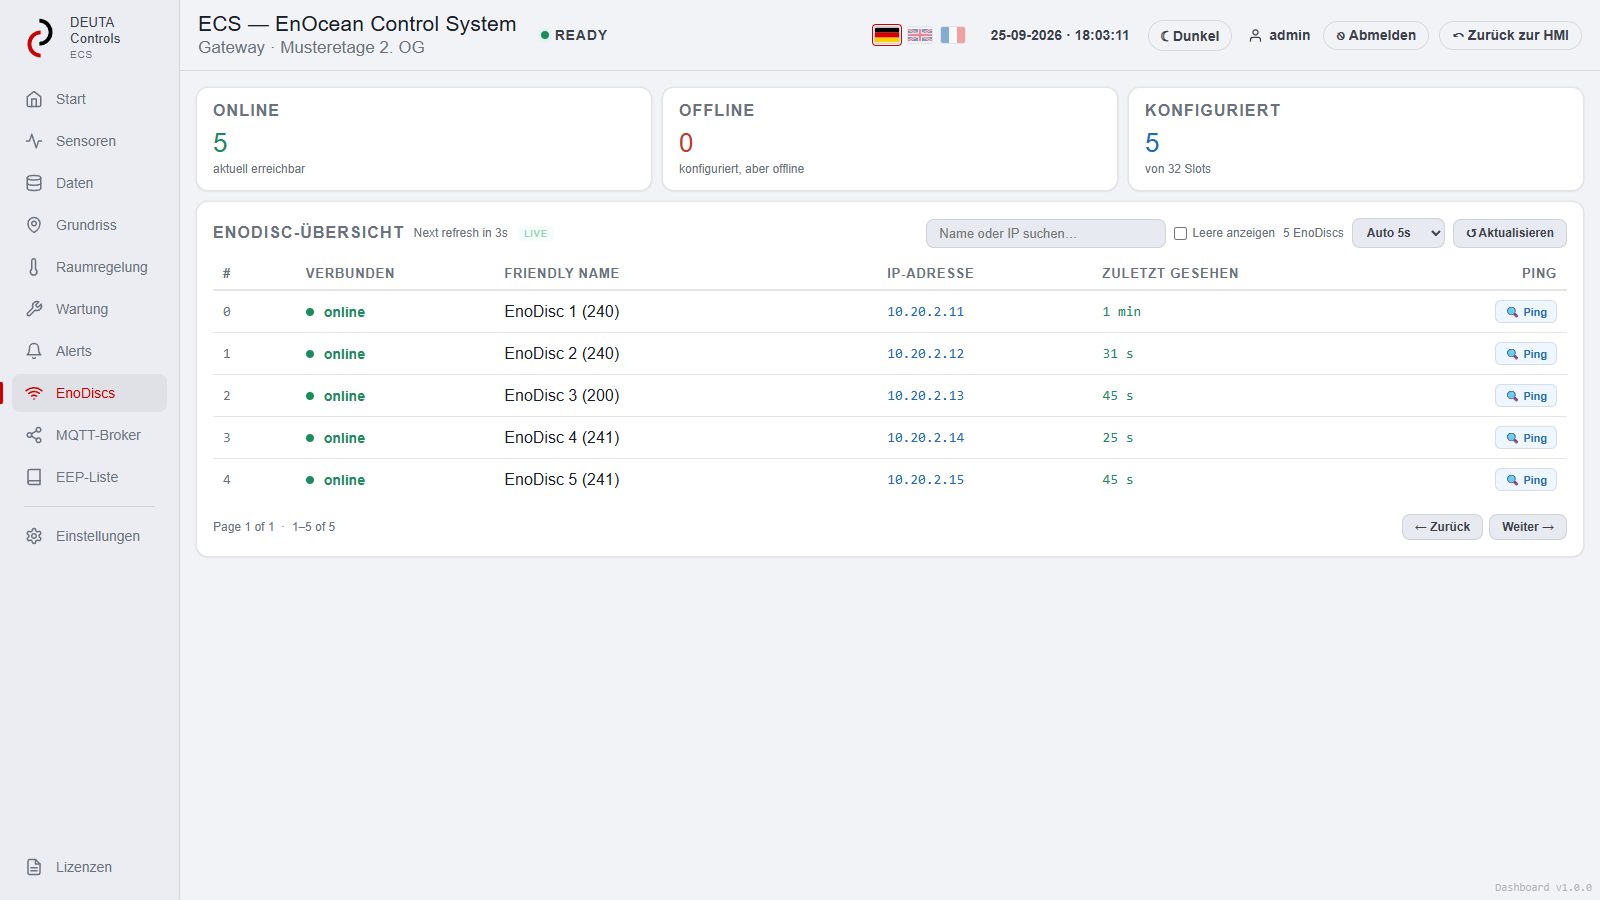
Each EnoDisc® displays its name, IP address, connection status, and last contact. A ping test checks the network link directly from the dashboard. This makes it easy to quickly determine whether the problem lies with the receiver or the link in the event of a signal loss.
Four Brokers, One Look
MQTT BrokersThe MQTT page displays the gateway’s four broker slots, including address, client ID, topic template, QoS, TLS, and connection status. The topic configuration used is a system setting and is displayed here.
The measured values are sent to the broker of your choice in JSON format; BACnet, KNX, and Modbus TCP are available in parallel.
Individual room control for up to 16 rooms
Room Control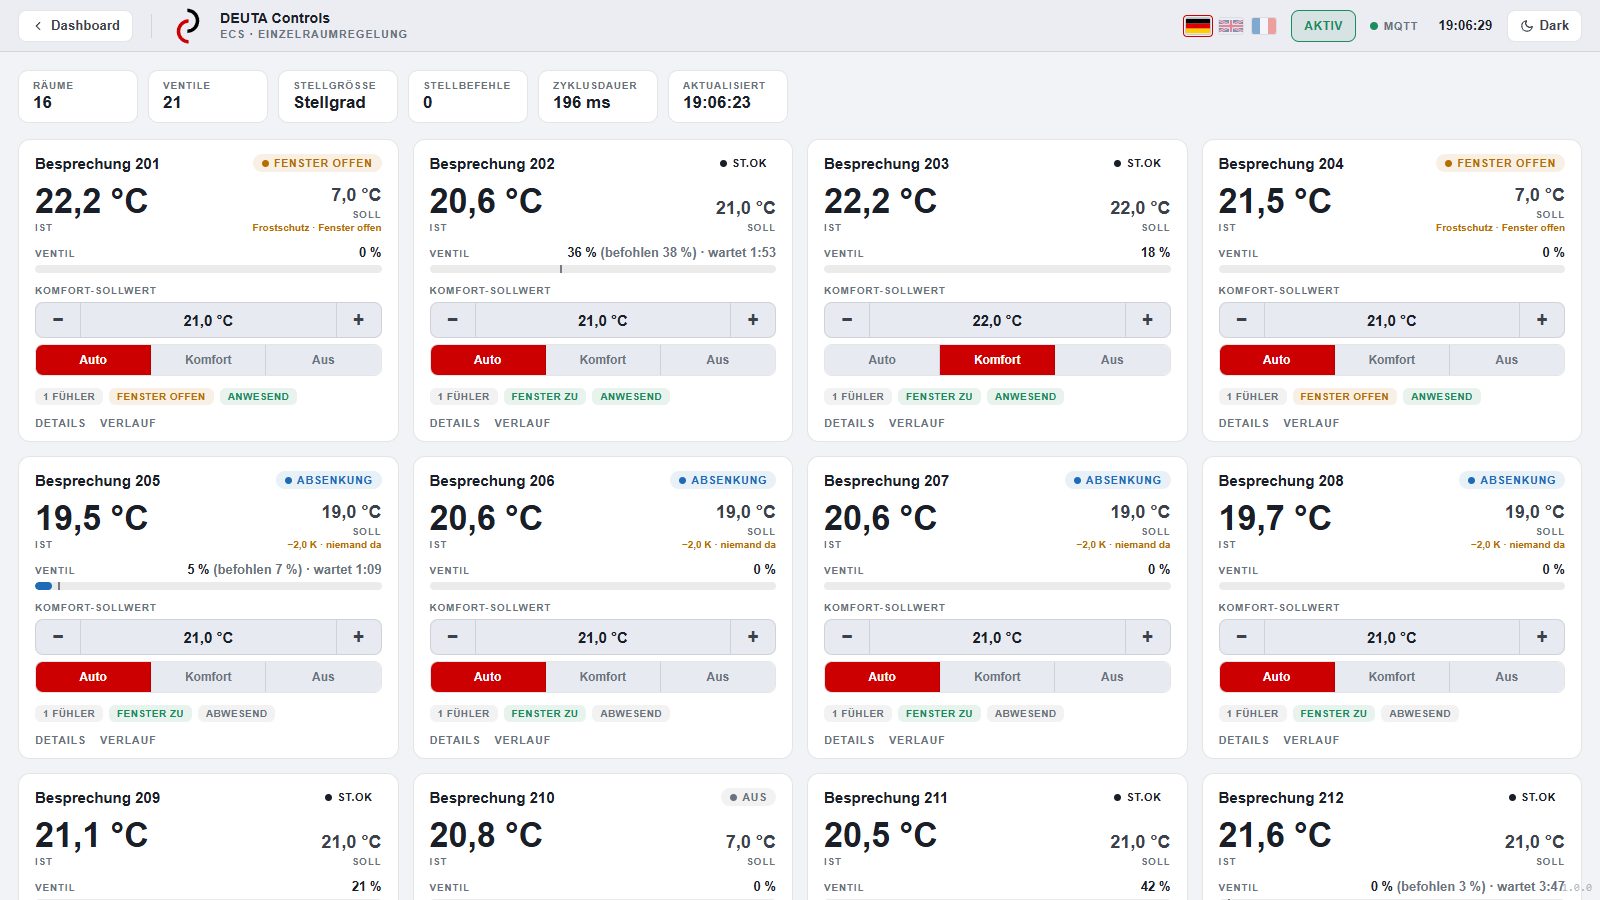
Where the gateway also controls the heating, each room has its own tile: current temperature, setpoint, operating mode (Auto, Comfort, or Off), valve position, and the window contact that reduces the heating when the window is open. Setpoints can be adjusted directly here.
Names, Thresholds, and Device Profiles
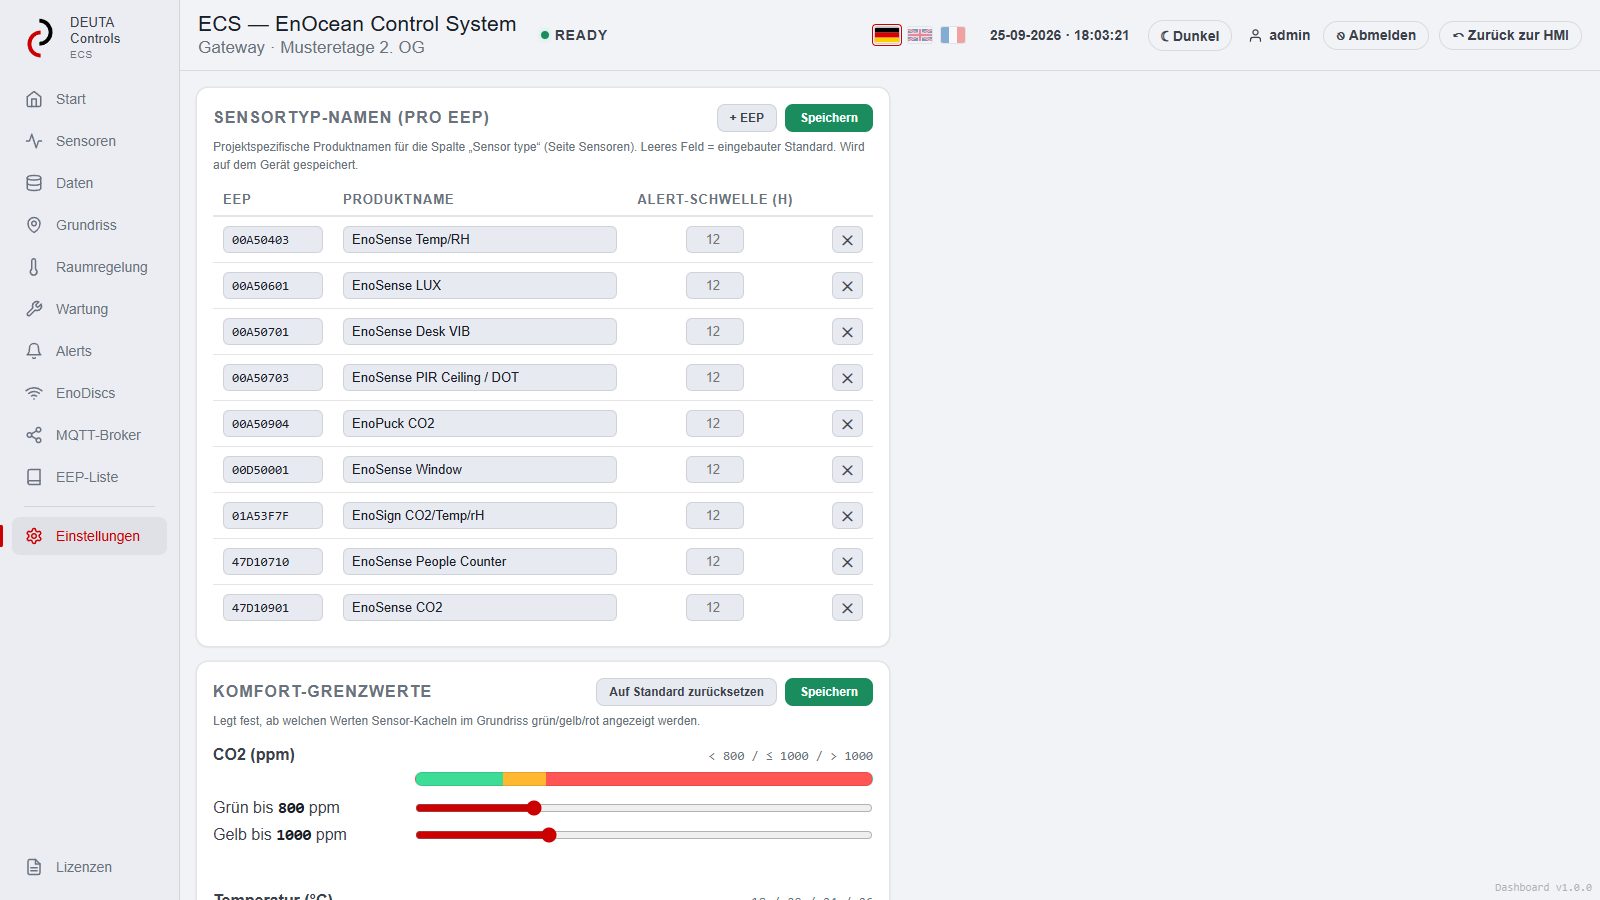
Settings and EEP ListIn the settings, you can assign product names to each device profile, set the alert thresholds and comfort limits for CO2, temperature, and humidity—based on which the floor plan changes color. The EEP list displays all profiles recognized by the gateway, organized by manufacturer groups.
Two roles: The administrator makes changes; the user views them. The interface is available in German, English, and French, in either light or dark mode.
What this means for operations
5 points- The dashboard runs on the gateway itself. It requires no server, no cloud, and no installation on the user’s end—just a browser connected to the building’s network.
- External access is available upon request via the Remote Support Desk, an outbound VPN connection with no open ports.
- The history of measured values is stored as files on the gateway, allowing users to review data over the course of days and weeks. For data spanning years, the values are stored in the target system, which receives the data via MQTT, BACnet, KNX, or Modbus TCP.
- All lists can be exported as CSV or Excel files; the entire system’s configuration is stored in a single file that can be backed up and restored.
- No recurring costs: no license fee per sensor, no fee per user. The system scales by adding additional gateways.
Want to see the dashboard with your rooms?
Send us the floor plan, dimensions, and target system. You’ll receive a recommendation for the number of devices, a list of part numbers, and a quote—and, if you’d like, access to a live dashboard.
Images: ECS Dashboard v1.0 with the sample floor (fictional floor plan, 115 devices). As of September 25, 2026.